reading-notes
Charts
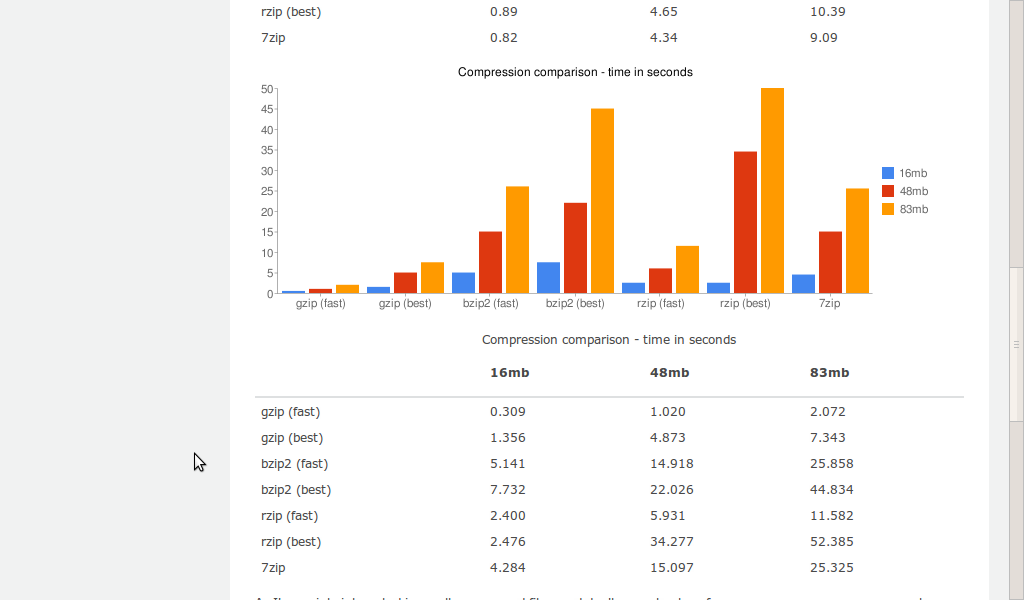
Charts are far better for displaying data visually than tables and have the added benefit that no one is ever going to press-gang them into use as a layout tool. They’re easier to look at and convey data quickly, but they’re not always easy to createز
Setting up
The first thing we need to do is download Chart.js. Copy the Chart.min.js out of the unzipped folder and into the directory you’ll be working in
Drawing a line chart
To draw a line chart, the first thing we need to do is create a canvas element in our HTML in which Chart.js can draw our chart
Inside the same script tags we need to create our data, in this instance it’s an object that contains labels for the base of our chart and datasets to describe the values on the chart.
Drawing a pie chart Our line chart is complete, so let’s move on to our pie chart. First, we need the canvas element:
canvas idc ountries width 600 height 400 canvas Next, we need to get the context and to instantiate the chart:
var countries= document.getElementById(“countries”).getContext(“2d”); new Chart(countries).Pie(pieData, pieOptions); You’ll notice that this time, we are going to supply some options to the chart.
Next we need to create the data. This data is a little different to the line chart because the pie chart is simpler, we just need to supply a value and a color for each section:
var pieData value 20, color “#878BB6” value 40,color : “#4ACAB4” value 10, color “#FF8153” value : 30, color : “#FFEA88” Now, immediately after the pieData we’ll add our options: var pieOptions segmentShowStroke :false, animateScale true These options do two things, first they remove the stroke from the segments, and then they animate the scale of the pie so that it zooms out from nothing.
Basic usage of canvas
Let’s start this tutorial by looking at the canvas HTML element itself. At the end of this page, you will know how to set up a canvas 2D context and have drawn a first example in your browser.
The canvas element canvas id=”tutorial” width=”150” height=”150”>canvas At first sight a
Note: If your renderings seem distorted, try specifying your width and height attributes explicitly in the canvas attributes, and not using CSS.
The id attribute isn’t specific to the ؤanvas element but is one of the global HTML attributes which can be applied to any HTML element (like class for instance). It is always a good idea to supply an id because this makes it much easier to identify it in a script.
The canvas element can be styled just like any normal image (margin, border, background…). These rules, however, don’t affect the actual drawing on the canvas. We’ll see how this is done in a dedicated chapter of this tutorial. When no styling rules are applied to the canvas it will initially be fully transparent.
Fallback content The canvas element differs from an img tag in that, like for video, audio, or picture elements, it is easy to define some fallback content, to be displayed in older browsers not supporting it, like versions of Internet Explorer earlier than version 9 or textual browsers. You should always provide fallback content to be displayed by those browsers.
Providing fallback content is very straightforward: just insert the alternate content inside the
Drawing shapes with canvas
Now that we have set up our canvas environment, we can get into the details of how to draw on the canvas. By the end of this article, you will have learned how to draw rectangles, triangles, lines, arcs and curves, providing familiarity with some of the basic shapes. Working with paths is essential when drawing objects onto the canvas and we will see how that can be done.
The grid Before we can start drawing, we need to talk about the canvas grid or coordinate space. Our HTML skeleton from the previous page had a canvas element 150 pixels wide and 150 pixels high. To the right, you see this canvas with the default grid overlayed. Normally 1 unit in the grid corresponds to 1 pixel on the canvas. The origin of this grid is positioned in the top left corner at coordinate (0,0). All elements are placed relative to this origin. So the position of the top left corner of the blue square becomes x pixels from the left and y pixels from the top, at coordinate (x,y). Later in this tutorial we’ll see how we can translate the origin to a different position, rotate the grid and even scale it, but for now we’ll stick to the default.
Drawing rectangles Unlike SVG,
First let’s look at the rectangle. There are three functions that draw rectangles on the canvas:
fillRect(x, y, width, height) Draws a filled rectangle. strokeRect(x, y, width, height) Draws a rectangular outline. clearRect(x, y, width, height) Clears the specified rectangular area, making it fully transparent. Each of these three functions takes the same parameters. x and y specify the position on the canvas (relative to the origin) of the top-left corner of the rectangle. width and height provide the rectangle’s size.
Below is the draw() function from the previous page, but now it is making use of these three functions.
Drawing paths Now let’s look at paths. A path is a list of points, connected by segments of lines that can be of different shapes, curved or not, of different width and of different color. A path, or even a subpath, can be closed. To make shapes using paths, we take some extra steps:
First, you create the path. Then you use drawing commands to draw into the path. Once the path has been created, you can stroke or fill the path to render it. Here are the functions used to perform these steps:
beginPath() Creates a new path. Once created, future drawing commands are directed into the path and used to build the path up. Path methods Methods to set different paths for objects. closePath() Adds a straight line to the path, going to the start of the current sub-path. stroke() Draws the shape by stroking its outline. fill() Draws a solid shape by filling the path’s content area. The first step to create a path is to call the beginPath(). Internally, paths are stored as a list of sub-paths (lines, arcs, etc) which together form a shape. Every time this method is called, the list is reset and we can start drawing new shapes.
Applying styles and colors « Previous Next » In the chapter about drawing shapes, we used only the default line and fill styles. Here we will explore the canvas options we have at our disposal to make our drawings a little more attractive. You will learn how to add different colors, line styles, gradients, patterns and shadows to your drawings.
Colors Up until now we have only seen methods of the drawing context. If we want to apply colors to a shape, there are two important properties we can use: fillStyle and strokeStyle.
fillStyle = color Sets the style used when filling shapes. strokeStyle = color Sets the style for shapes’ outlines. color is a string representing a CSS color, a gradient object, or a pattern object. We’ll look at gradient and pattern objects later. By default, the stroke and fill color are set to black
A fillStyle example In this example, we once again use two for loops to draw a grid of rectangles, each in a different color. The resulting image should look something like the screenshot. There is nothing too spectacular happening here. We use the two variables i and j to generate a unique RGB color for each square, and only modify the red and green values. The blue channel has a fixed value. By modifying the channels, you can generate all kinds of palettes. By increasing the steps, you can achieve something that looks like the color palettes Photoshop uses.